Flight Recorders for Agent Runs
A field note on Decant, Prism-Eval, aakit, async-bulkhead-llm, LongHorizon-Harness, AgentSight, ActPlane, Debroid, and why agent systems need run records that survive the transcript.
The transcript is a weak debugger.
It tells you what the agent said. It may show a few tool calls. It rarely tells you which request got admitted, which budget rule allowed it, which process wrote a file, which evidence invalidated an assumption, which test gate failed, or which action a runtime policy killed.
That gap matters more as agents run longer. A one-shot assistant can fail in a chat bubble. A long-running agent fails across commands, files, network calls, browser state, subprocesses, checkpoints, and half-finished repairs. You need a flight recorder for the run, not a prettier transcript after the damage.
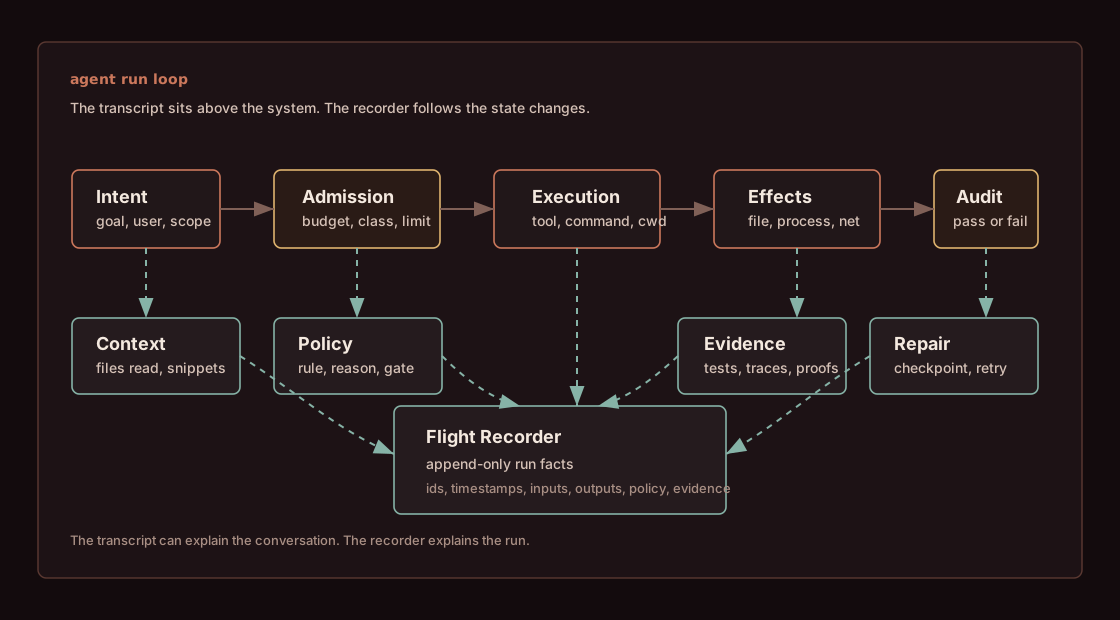
A useful recorder sits beside the agent loop. It records admission, execution, machine effects, evidence, policy decisions, and repair state as separate objects.
The Recorder Surface
The useful tools I checked shared a shape:
intent
  -> admission decision
  -> bounded execution
  -> machine-level effects
  -> evidence and tests
  -> policy result
  -> repair or checkpoint
Each arrow needs a record. If a run blows up, the operator should not search ten thousand tokens of chat to answer basic questions:
- Did batch work starve interactive work?
- Did the agent use a stale assumption?
- Did a prompt injection get accepted?
- Did the sandbox hide the useful evidence?
- Did the agent touch the Android runtime or only edit code?
- Did a policy block the right action with a reason the agent can use?
- Did the loop preserve verified state or just keep retrying?
That is the difference between an agent demo and an agent system.
My Trial Bench
I kept the bench practical: Windows 11, PowerShell, Node 24, npm 11, uv, Rust, no paid model calls, no Android device, no Linux eBPF host. I ran install, help, test, doctor, and code-inspection checks where the project allowed it.
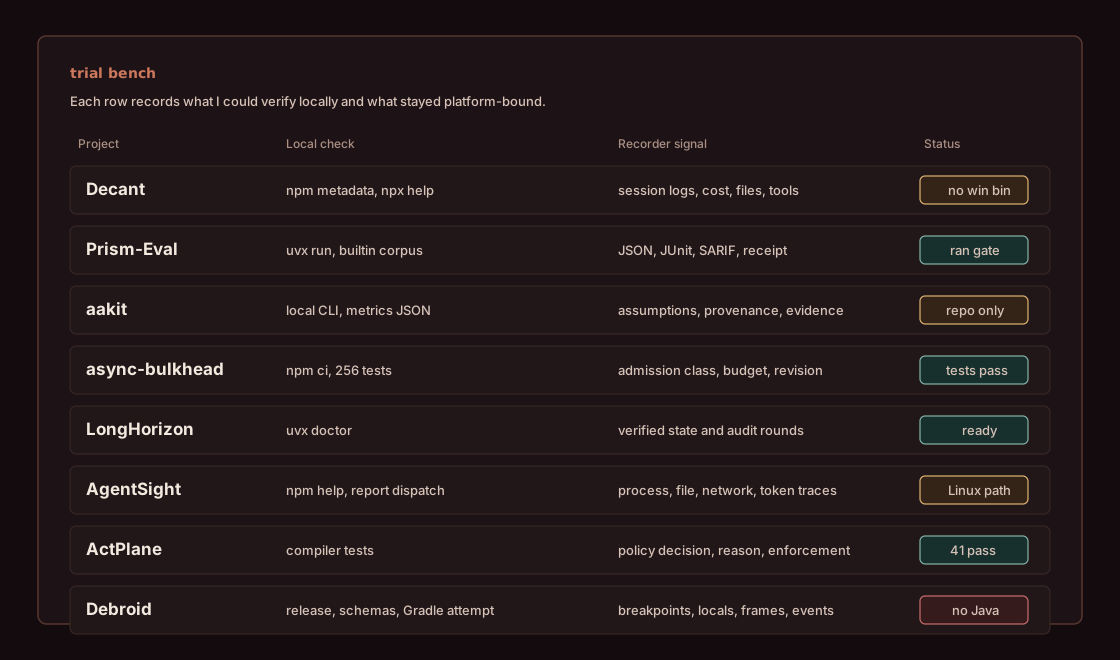
The checks favored operator truth: command surface, generated reports, test gates, JSON schemas, policy compiler tests, and explicit platform limits.
| Project | Check | Result | Read |
|---|---|---|---|
| Decant | npm view, npx --yes @dosu/decant@latest --help | Package exists as 0.4.0, but the CLI exits on Windows: no win32/x64 binary. | Good local log analytics idea. The first-run platform boundary is real. |
| Prism-Eval | uvx --from prism-eval prism-eval ... | CLI ran. Builtin corpus produced 1/42 pass with JSON, JUnit, SARIF, and audit receipt files. | Useful CI gate shape. The default/no-agent path fails loudly, which is fine. |
| aakit | Local checkout, uv run aakit init/status/metrics | CLI initialized ~/.aakit, reported zero tasks, and returned insufficient_n. Not published on PyPI. | Strong measurement design, repo-only install surface. |
| async-bulkhead-llm | npm ci, npm run test:run, npm audit --json | 256 tests passed. npm audit reported one high-severity transitive nanoid advisory. | Real code and real tests. Dependency hygiene still needs attention. |
| LongHorizon-Harness | uvx --from lh-harness lh-harness doctor | Doctor found Python, Codex, Claude Code, npm, Node, and Codex computer-use. Result: ready. | The best first-run diagnostic in this set. |
| AgentSight | npx --yes @eunomia-bpf/agentsight --help, report --help | Web/package help worked. Collector command failed with spawn EINVAL on Windows. | Good split between web shell and Linux collector. Platform story must stay explicit. |
| ActPlane | cargo test -p actplane-ifc-compiler --no-default-features | 41 tests passed, 1 ignored. | Policy compiler is testable without loading eBPF. Enforcement still needs Linux. |
| Debroid | Gradle test attempt, schema/code inspection | Tests could not run because Java is missing. Release assets exist. JSON schemas and command models are concrete. | Strong Android runtime-debug surface. I did not verify a live device path. |
This is not a benchmark. It is a smell test for whether a tool gives operators something to inspect when an agent does real work.
Decant Starts After the Run
Decant takes the most direct route: parse the logs your local coding agents already write, then index sessions, costs, context usage, tool calls, files, MCP activity, and transcripts into a local archive.
Package metadata looked real:
npm view @dosu/decant version description bin dist.unpackedSize --json
returned:
{
  "version": "0.4.0",
  "description": "Local-first analytics for Claude Code and Codex sessions, built by Dosu.",
  "bin": {
    "decant": "bin/decant.cjs"
  },
  "dist.unpackedSize": 22718
}
The first run stopped fast:
npx --yes @dosu/decant@latest --help

decant: Decant does not ship a binary for win32/x64.
Supported targets: darwin/arm64, darwin/x64, linux/arm64, linux/x64.
I prefer that to a half-working Windows path. The CLI names the boundary. It does not pretend.
The product idea still matters. Teams already have agent transcripts sitting in local folders. Those transcripts contain enough signal to ask:
| Question | Recorder field |
|---|---|
| Which files did agents touch most? | File access and write index. |
| Which tools burned time? | Tool-call duration and retries. |
| Which sessions ran hot? | Token and context-window stats. |
| Which MCP servers appeared in a run? | MCP call catalog. |
| Which transcript explains a regression? | Searchable session archive. |
Application observability starts at instrumentation time. Agent observability often has to start after the fact because the agent CLI is closed, changing, or already deployed. Decant attacks that messy reality.
Prism-Eval Gives Agent QA a Hard Exit Code
Prism-Eval exposes the kind of gate agents need in CI. The help surface is narrow:
uvx --from prism-eval prism-eval --help
showed required --policy-id and --corpus, plus outputs for JSON, JUnit, SARIF, and immutable audit receipt:
--json-out JSON_OUT
--junit JUNIT
--sarif SARIF
--audit-receipt AUDIT_RECEIPT
I ran the builtin corpus without wiring a real agent:
uvx --from prism-eval prism-eval \
  --policy-id smoke \
  --corpus builtin \
  --json-out report.json \
  --junit junit.xml \
  --sarif report.sarif \
  --audit-receipt receipt.json \
  --no-upsell
The suite failed:
Cases:                     1/42 passed
Suite pass rate:           2.4% (Target: 95.0%)
Mean determinism:          2.4% (Per-case min: 95.0%)
Critical failures:         5
False accepts:             3 (critical: 3)
G4 invariant:              BROKEN
Result:                    FAIL
Audit receipt: ...\receipt.json (hash=df4f6c84e316f032...)
That failure does not bother me. I did not connect a real target agent. The useful part is the shape of the failure:
- exit code
1 - attack-type breakdown
- false-accept counts
- JUnit for CI
- SARIF for code-scanning surfaces
- JSON for dashboards
- hash-backed receipt for audit
Agent QA should look like this. A prompt-injection test should not produce a paragraph saying "the model appears safer." It should fail a build and leave artifacts.
aakit Measures Assumptions Instead of Arguing About Them
aakit has the best intellectual restraint in the set. It does not assume silent assumptions are always expensive. It tries to measure three things:
| Experiment | Number |
|---|---|
| Base rate | How often silent assumptions are wrong and load-bearing. |
| Ask policy | Whether gated questions beat never-ask and always-ask. |
| Defeater loop | Whether targeted repair beats starting over. |
The project is not on PyPI:
uvx --from aakit aakit --help

Because aakit was not found in the package registry...
The local checkout worked:
uv run aakit --help
exposed:
init, ingest, extract, calibrate, review, auto-review, metrics, report,
ab, observe, defeats, confirm, repair, export, status
Then:
uv run aakit init
uv run aakit status
uv run aakit metrics --json
returned:
initialised C:\Users\xjxf0\.aakit
db          C:\Users\xjxf0\.aakit\aakit.db
backend     cli   model claude-sonnet-4-5
transcripts C:\Users\xjxf0\.claude\projects

tasks            0
assumptions      0
human_verdicts   0
evidence         0
defeats          0

30 more human verdicts before experiment 1 has enough n.
The JSON metrics said kill_verdict: "insufficient_n".
That is a good default. A measurement tool should refuse to overclaim when it has no data.
The smoke test also found a Windows rough edge. It passed the logical checks, then Python failed to delete a temporary SQLite file:
PermissionError: [WinError 32] ... t.db
The repo already contains the right domain model: Task, Assumption, Verdict, Evidence, Defeat, AskTrial, and RepairTrial. The key field is provenance, with values such as invented, from_context, from_evidence, and from_convention.
That field matters. If an agent guessed, you fix asking behavior. If it inferred from real evidence, you fix reading and verification. If it followed convention, you fix project policy. One label can save a team from treating every failure as the same failure.
async-bulkhead-llm Records Admission, Not Only Cost
LLM gateways need a gate before the model call. async-bulkhead-llm gives that gate a TypeScript API:
- max in-flight concurrency
- token-aware admission
- class floors and ceilings
- priority reserve
- fail-fast rejection
- observe mode
- in-flight deduplication
- streaming reconciliation
- exact limit revision per admitted call
The tests are not decorative:
npm ci
npm run test:run
returned:
Test Files  10 passed (10)
Tests       256 passed (256)
Duration    6.13s
The code surface includes wouldAdmit(), acquire(), run(), applyLimits(), stats(), and admission-class snapshots. The tests cover class ceilings, protected floors, deduplication by class, reconfiguration, streaming dedup, and observe mode.
This is the run-recorder layer before execution:
request -> estimate tokens -> choose admission class
        -> reserve slot and budget under revision N
        -> run or reject with structured reason
        -> reconcile actual usage
The audit result was mixed:
npm audit --json
reported one high-severity transitive nanoid advisory:
{
  "name": "nanoid",
  "severity": "high",
  "title": "nanoid: custom generators can loop indefinitely when size is zero",
  "range": "<3.3.17",
  "fixAvailable": true
}
That does not erase the design. It does mean a gateway library should keep dependency hygiene tight. Admission control sits on a hot path. Teams will not want a security exception attached to the component that protects the rest of the system from overload.
LongHorizon-Harness Treats Progress as Verified State
LongHorizon-Harness attacks the long-run problem directly. It wraps existing agents with Manager, Executor, and Auditor roles. The important part is not the role names. The important part is that only audited progress becomes state.
The CLI installed and told me what it can do:
uvx --from lh-harness lh-harness --help
returned:
run
dashboard
web
doctor
plugin
init
check-update
The doctor output was better than most agent tools:
LongHorizon-Harness doctor (0.1.4)
Platform: Windows-11-10.0.26200-SP0
[OK  ] Python: 3.12.8
[SKIP] Project config: .lh-harness\config.toml does not exist
[OK  ] claude_code: 2.1.170
[OK  ] codex: 0.141.0
[OK  ] npm: 11.16.0
[OK  ] Node.js: 24.18.1
[OK  ] codex-computer-use: computer-use@openai-bundled 26.803.81509 is enabled
[SKIP] open-computer-use: not installed
[SKIP] clawdcursor: not installed
[OK  ] Computer use (codex): codex-computer-use
[OK  ] Update: 0.1.4 is the latest version
Doctor result: ready
This is the right kind of preflight. It checks real binaries with --version, not just PATH. It knows which computer-use plugin each backend can load. It separates missing project config from broken runtime.
The repo is large because it includes evaluation harnesses and a browser workbench. The useful product contract is small:
original goal
verified progress
failure evidence
next bounded step
executor result
auditor decision
checkpoint
run report
A long-running agent that cannot separate "claimed progress" from "verified progress" will eventually lie to itself. LongHorizon-Harness makes that split a first-class object.
AgentSight Watches the Machine Boundary
Most agent logs end at the framework boundary. The agent says it ran a command. The framework records a tool call. The operating system knows more.
AgentSight tries to observe that lower layer with eBPF and session parsers. The npm package provides the web shell:
npm view @eunomia-bpf/agentsight version description bin dist.unpackedSize --json
returned:
{
  "version": "1.0.15",
  "description": "Official npm entrypoint for Eunomia AgentSight, a system-level AI agent observability tool with an eBPF collector and Web trace viewer.",
  "bin": {
    "agentsight": "bin/agentsight.js"
  },
  "dist.unpackedSize": 3088914
}
Help worked:
npx --yes @eunomia-bpf/agentsight --help
returned:
AgentSight 1.0.15

Usage:
  agentsight.js web [--host 127.0.0.1] [--port 7395]
  agentsight.js serve --snapshot snapshot.json [--host 127.0.0.1] [--port 7395]
  agentsight.js open snapshot.json [--host 127.0.0.1] [--port 7395]
  agentsight.js record|top|monitor|stat|report|debug ...

Web commands are implemented by this npm package. Collector commands delegate to
a real AgentSight collector binary when one is available.
The collector path did not work on this machine:
npx --yes @eunomia-bpf/agentsight report --help

agentsight.js: spawn EINVAL
That is a fair platform limit. eBPF belongs to Linux. The repo also says capture logs can contain prompts, responses, paths, headers, and network targets. Good. A flight recorder is sensitive by default.
The codebase has several useful pieces:
| Module | Role |
|---|---|
agent-session | Portable session IR for Codex, Claude, Gemini, and other local transcripts. |
agentsight-capture | Capture and analysis pipeline with SQLite storage. |
agentpprof | Offline profiles and flamegraphs for agent stacks. |
| npm wrapper | Web viewer and collector dispatch. |
This is the right layer for questions the transcript cannot answer:
- which subprocess ran
- which files changed outside the agent's summary
- which network endpoints received traffic
- where tokens and time clustered
- which loops repeated after a failure
The caveat is operational weight. eBPF capture needs privileges and Linux support. That is not a reason to skip it. It is a reason to make the platform boundary loud.
ActPlane Moves From Seeing to Stopping
Observation tells you what happened. Enforcement stops the wrong thing before it happens.
ActPlane compiles a policy language into OS-level information-flow rules for agent harnesses. The default policy shape is readable:
policy: |
  source AGENT = exec "**/claude"
  source AGENT = exec "**/codex"

  rule no-git-branch:
    kill exec "git" "branch"   if AGENT
    kill exec "git" "worktree" if AGENT
    because "This workspace forbids creating git branches or worktrees."

  rule no-auto-commit:
    block exec "git" "commit"
      if AGENT unless after write ".actplane/commit-approved"
        since exec "git" "commit"
    because "Write to .actplane/commit-approved after user says 'commit'."
I could not load kernel enforcement on Windows. I could test the compiler:
cargo test -p actplane-ifc-compiler --no-default-features
returned:
running 42 tests
...
test result: ok. 41 passed; 0 failed; 1 ignored
The test names describe the real design:
e1_secret_no_exfile2_prompt_injectione4_workspace_confinemente5_test_before_commite10_pii_egresse12_non_interferencedomain_policy_corpus_all_domains_compile
That is the move from "agent guidelines" to "runtime law." The rule carries a human-readable because field so the agent can recover:
blocked -> read reason -> run tests -> retry commit
This matters. A sandbox that only returns EPERM teaches the agent nothing. A policy engine that returns the project rule gives the agent a path back to valid work.
Debroid Gives Mobile Agents a Runtime Lens
Coding agents can edit Android code, but most cannot debug a live app through Android Studio. Debroid exposes a headless CLI over JDWP so an agent can set breakpoints, inspect locals, watch fields, poll debugger events, and step execution through JSON commands.
I did not run Debroid. This machine has no Java:
.\gradlew.bat :cli:test --no-daemon

ERROR: JAVA_HOME is set to an invalid directory
ERROR: JAVA_HOME is not set and no 'java' command could be found in your PATH.
The release assets are real:
{
  "tag_name": "v0.1.0",
  "assets": [
    { "name": "debroid", "size": 13381711 },
    { "name": "debroid.jar", "size": 13381564 },
    { "name": "debroid.jar.sha256", "size": 78 },
    { "name": "debroid.sha256", "size": 74 }
  ]
}
The stronger signal came from the command and schema model. The CLI includes commands for:
launch, attach, detach, break, remove-break, catch-exception,
watch, points, threads, locals, pause-state, set-var, eval,
resume, poll, frames, coroutine, inspect, step, update
The generated JSON schema for points includes breakpoints, exceptionBreakpoints, and watchpoints. session-status includes:
{
  "sessionId": "string",
  "appId": "string",
  "connected": "boolean",
  "activeBreakpointsCount": "integer",
  "suspendedThreadsCount": "integer"
}
This is exactly the runtime lens mobile agents need. A code diff does not prove an Android fix. A suspended thread with locals, frames, and a breakpoint hit gets much closer.
The missing Java setup is not a minor footnote. If the tool expects agents to debug Android, first-run diagnostics should check Java, ADB, device state, app debuggability, and release binary integrity before the user asks an agent to use it.
Security Signals Point at the Same Need
Two security stories fit the same recorder pattern.
First, AI-bot spoofing makes user-agent strings weak evidence. If a server sees ClaudeBot, that does not prove an AI crawler made the request. The recorder needs stronger identity: IP range, DNS verification, signed agent identity, OAuth delegation, or product-side allow lists. Otherwise a security team will tune policy around spoofable text.
Second, context bombs show a strange but useful defensive idea: plant canary strings that trigger an attacking model's safety guardrails. Tracebit reports a large reduction in successful attack paths in its cyber range. I would not build a whole defense plan around that trick, but I like the recording implication. A canary should produce:
resource id
agent/session id
model route if known
tool that read it
network target after read
guardrail response
alert id
A sandbox can stop host escape. It cannot by itself explain what the agent read, sent, or tried. Runtime visibility and policy records fill that gap.
The Repos That Passed
I used a simple filter: does this project expose a record that helps an operator debug or govern a real agent run?
| Project | Why it passed | Caveat |
|---|---|---|
| Decant | Turns local agent logs into session, cost, file, tool, and transcript analytics. | No Windows binary in the package I tested. |
| Prism-Eval | Produces CI-grade JSON, JUnit, SARIF, and audit receipts for agent test failures. | A real value test needs a real target agent. |
| aakit | Measures assumptions with provenance, evidence, verdicts, and defeater loops. | Repo-only install; Windows temp DB cleanup issue in smoke test. |
| async-bulkhead-llm | Records admission decisions before model calls consume concurrency and token budget. | npm audit reported one high-severity transitive advisory. |
| LongHorizon-Harness | Separates claimed progress from verified state across long-running agent loops. | Actual long-run value depends on backend models and task harness quality. |
| AgentSight | Observes process, file, network, token, and session behavior below framework logs. | eBPF collector path needs Linux and privileges. |
| ActPlane | Compiles runtime policy with rule reasons agents can use to recover. | Enforcement path is Linux/eBPF; I only tested the compiler here. |
| Debroid | Gives Android agents JSON access to breakpoints, locals, frames, watches, and runtime events. | Java and device setup blocked live verification on this machine. |
I cut projects that only added a persona, a chat wrapper, or a thin dashboard without a durable record. A recorder has to survive the run. A screenshot of an agent UI does not count.
A Recorder Contract I Would Use
An agent run recorder should store separate records for separate facts:
run_id
task_id
operator_id
model_route
context_manifest
admission_decision
tool_call
process_event
file_event
network_event
evidence_event
policy_decision
test_result
assumption_record
checkpoint
repair_attempt
final_artifact
That looks like more work than a transcript. It saves time when the agent fails.
| Failure | Recorder query |
|---|---|
| Agent spent too much | Group by model route, admission class, and rejected requests. |
| Agent edited the wrong area | Query file events by policy domain and human-owned paths. |
| Agent got tricked by prompt injection | Link context source, tool read, model route, and test result. |
| Agent kept retrying | Find repeated process events, failed exits, and unchanged checkpoints. |
| Agent asked too many questions | Compare ask-policy trials against success and question count. |
| Agent made a bad assumption | Find provenance, supporting evidence, and repair blast radius. |
| Agent broke mobile runtime | Query breakpoint, frame, local, and event-poll records. |
The first version can use SQLite and JSONL. It does not need a giant platform. It needs stable ids and discipline.
Close
Agents keep getting better at doing work. The surrounding systems need to get better at remembering what happened.
A useful run record answers:
what got admitted
what ran
what changed
what left the machine
what evidence arrived
what policy fired
what progress became trusted
what repair followed
That is the layer I trust more than another bigger prompt. The transcript can stay in the UI. The flight recorder should decide whether the run can continue.
Sources
- Repository: dosu-ai/decant
- Package: @dosu/decant
- Repository: insightitsGit/prism-eval
- Package: prism-eval
- Repository: abhixhek/aakit
- Repository: janbalangue/async-bulkhead-llm
- Repository: AMAP-ML/LongHorizon-Harness
- Repository: eunomia-bpf/agentsight
- Repository: eunomia-bpf/ActPlane
- Repository: PatilShreyas/debroid
- Tracebit: Context bombs
- Known Agents: crawler and agent analytics
- Rye: sandbox runtime visibility
- AgentOAuth protocol repository