Trace-Based Evaluation for AI Agents
A practical survey of mainstream agent evaluation and observability tools, from trace viewers and event streams to datasets, scorers, and production feedback loops.
Agent evaluation used to mean running a prompt over a test set and checking whether the final answer looked right. That is still useful, but it is not enough for agents.
An agent does not only answer. It plans, retrieves, calls tools, edits state, retries, delegates, asks for clarification, and sometimes quietly burns money while appearing confident. The final answer is just the last artifact. The evidence lives in the trajectory.
For agent systems, the evaluation object should be the trace: the full run tree of model calls, tool calls, retrieval steps, planner decisions, guardrail checks, human feedback, and runtime events. A good eval platform makes those traces easy to inspect, score, sample into datasets, and replay after a prompt, model, tool, or policy change.
This is my field map of the current tooling market for agent traces, events, and evaluation.
The Evaluation Object Changed
The useful unit is no longer "prompt in, answer out." It is closer to:
- Trace: One end-to-end task, conversation turn, workflow, or user session.
- Span: A nested operation inside the trace, such as an LLM call, retrieval query, tool call, validator, or sub-agent.
- Event: A timestamped fact attached to the trace or span, such as retry, exception, token stream, handoff, policy warning, user feedback, or cost update.
- Dataset row: A trace, or a reduced version of a trace, promoted into a regression case.
- Score: A human, heuristic, model-graded, or programmatic judgment over the final answer, a span, or the full trajectory.
That structure matters because many agent failures are invisible at the final-answer layer. A support agent may produce a good reply after calling the wrong account API. A research agent may cite a valid source but ignore a required internal policy. A coding agent may pass tests while making the wrong file ownership assumption. These are trajectory failures, not just response failures.
What To Measure
I would separate agent quality into eight buckets:
- Task success: Did the agent complete the user-visible job?
- Trajectory correctness: Did it choose the right tools, in the right order, with the right arguments?
- Evidence quality: Did retrieval return the right documents, records, or citations?
- State and memory discipline: Did the agent preserve task context without leaking stale or irrelevant state?
- Safety and policy behavior: Did it refuse, escalate, redact, or ask for clarification when it should?
- User experience: Did the agent avoid unnecessary turns, confusing plans, and hidden work?
- Runtime economics: Did latency, token use, model selection, and retry count stay inside budget?
- Recoverability: When a tool failed, did the agent retry, choose a fallback, or stop cleanly?
The better platforms now treat these as connected parts of one loop: instrument production, inspect traces, label failures, create datasets, run offline experiments, deploy, and monitor online scores.
The Interface Pattern
Most products are converging on a similar UI grammar: a trace tree on the left, selected span details on the right, plus scores, metadata, token usage, latency, cost, and a path for turning production examples into eval data.
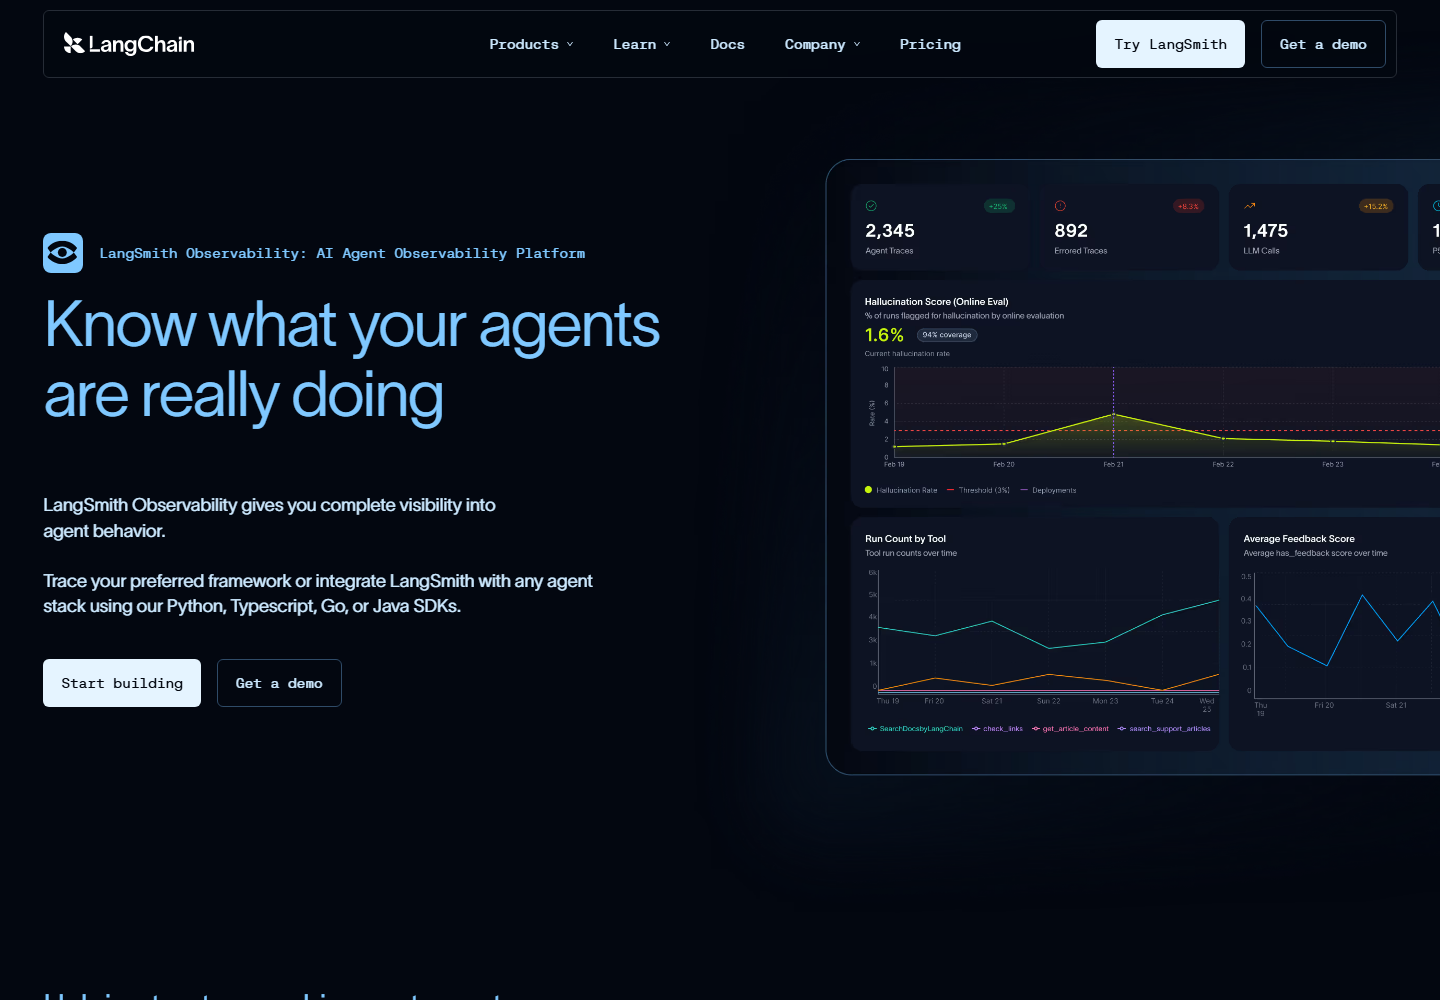
Source screenshot: LangSmith Observability.
LangSmith's public positioning is very direct: know what your agents are doing. The product is strongest when an agent is already built with LangChain or LangGraph, but the observability and evaluation model is broader than that. The key idea is the same loop I want from any serious agent platform: production traces, curated datasets, evaluators, offline experiments, and online monitoring.
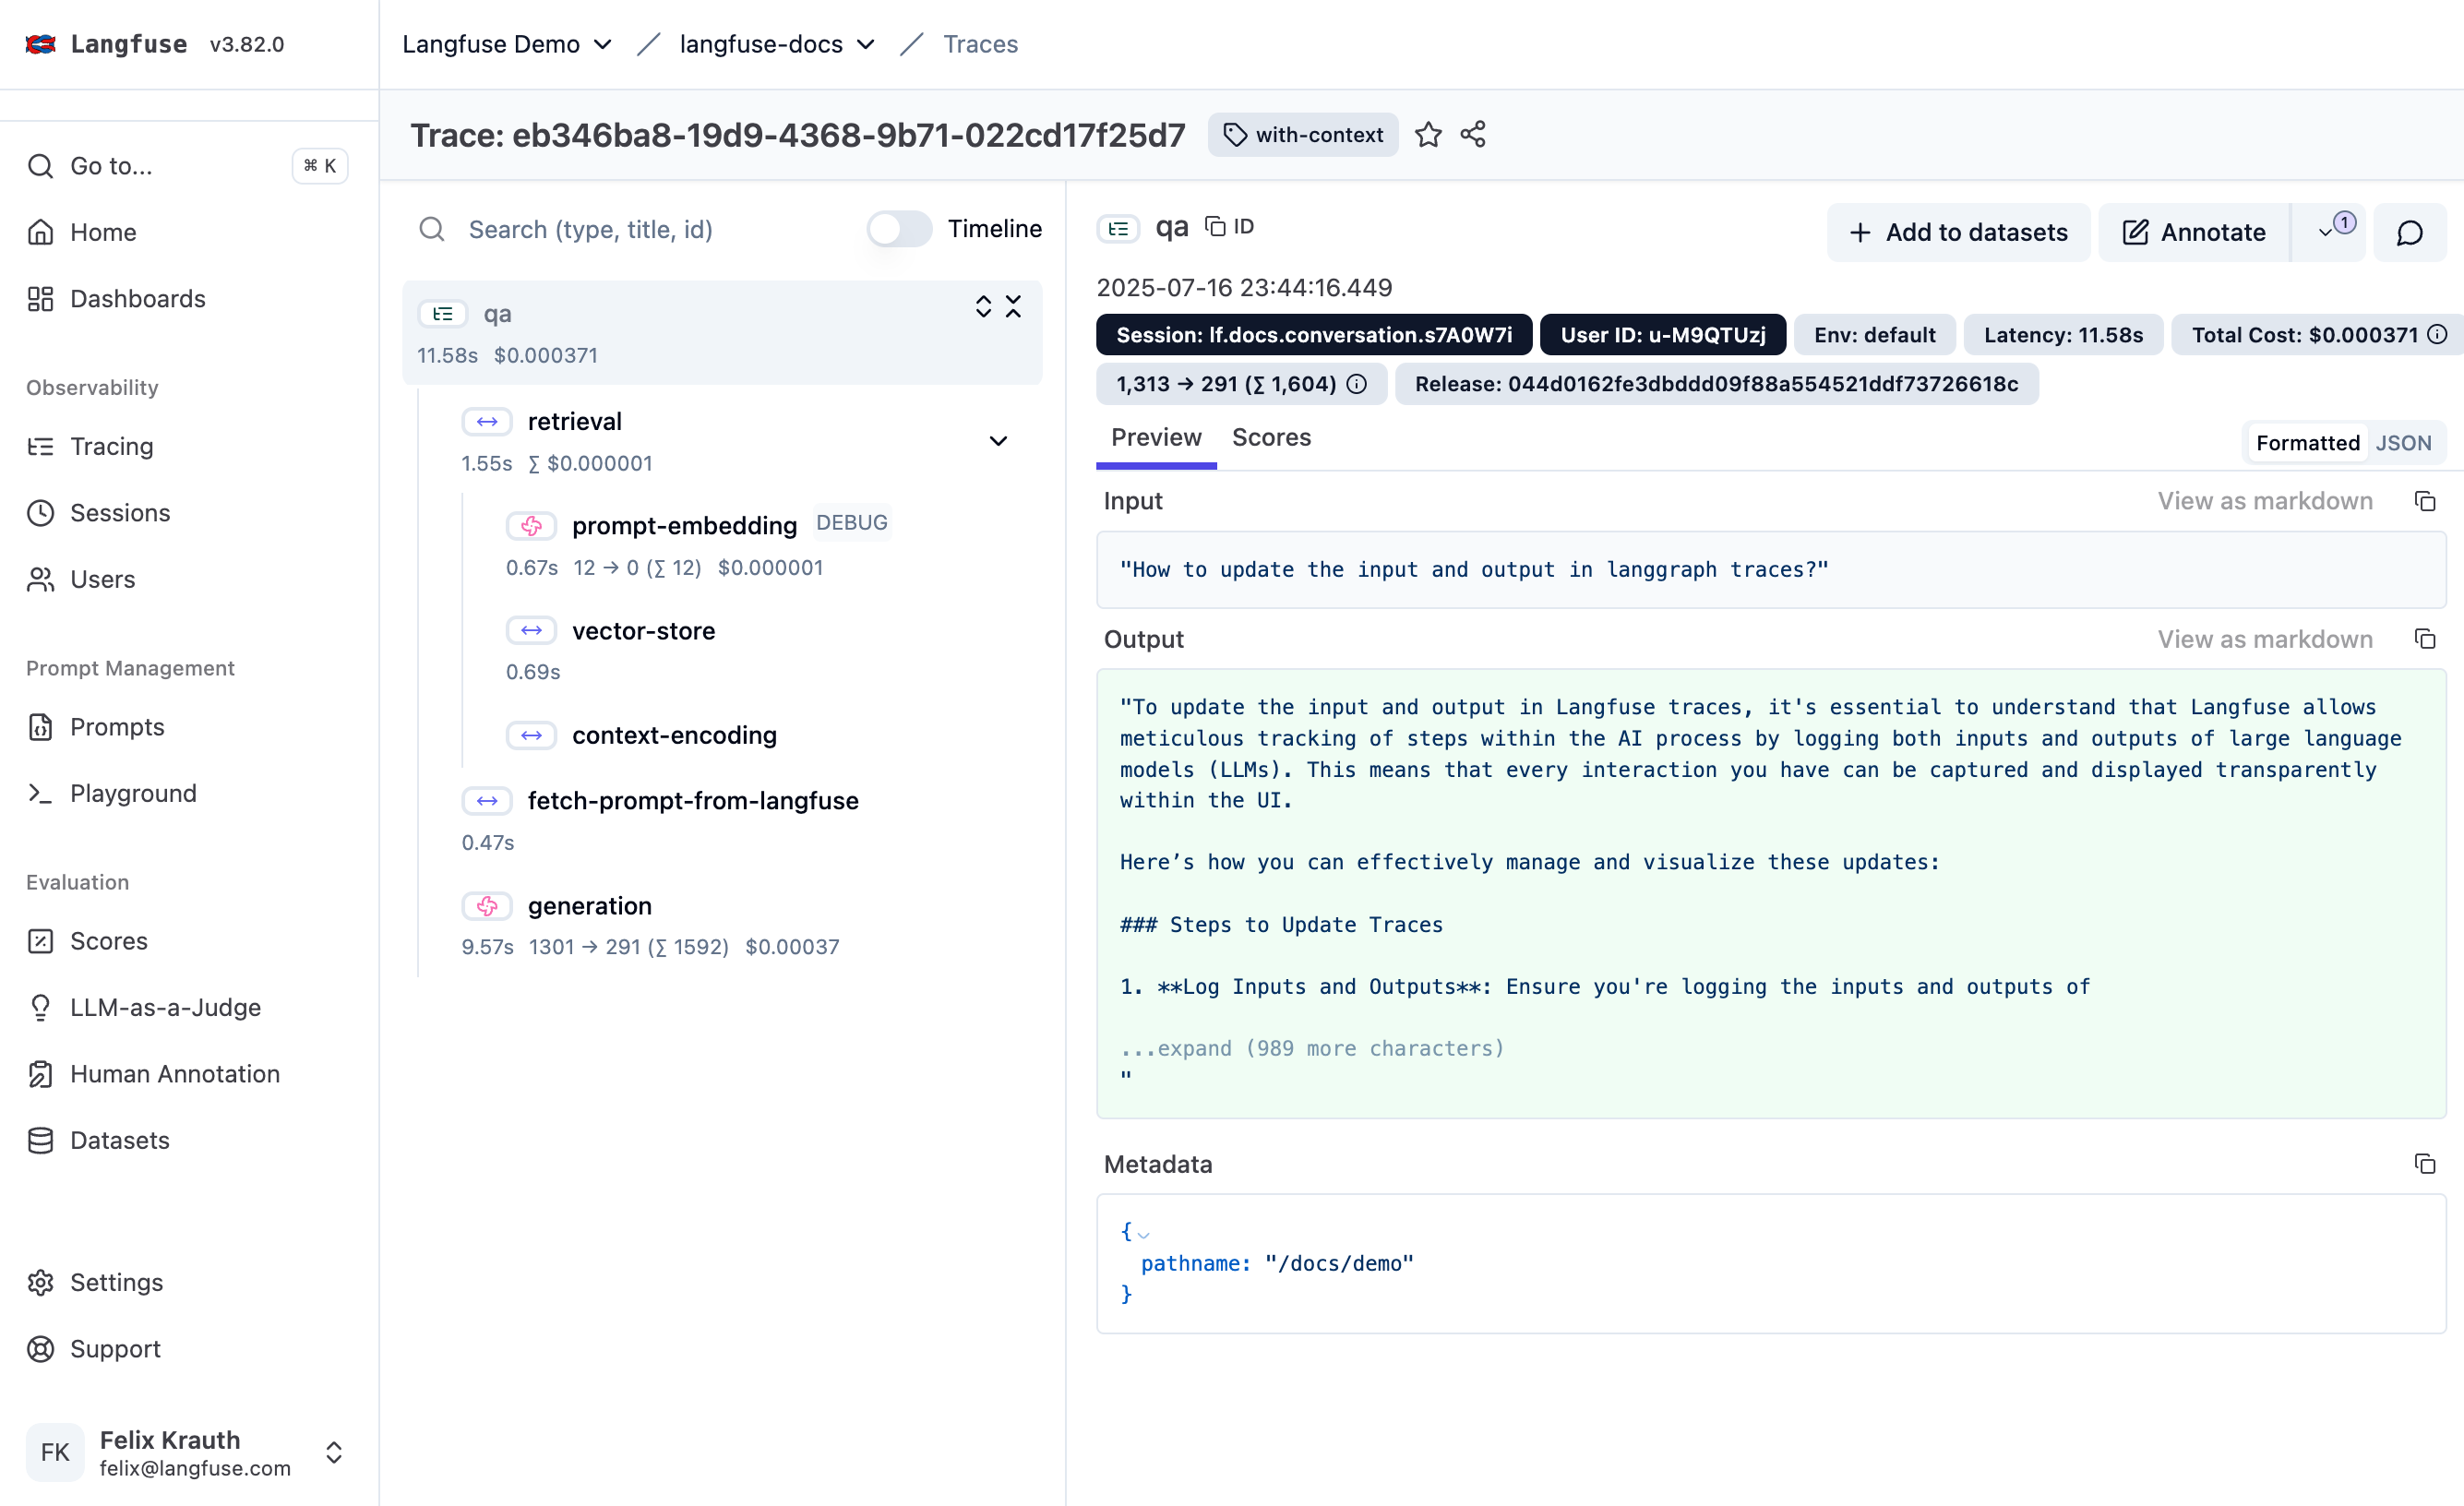
Source screenshot: Langfuse observability docs.
Langfuse shows the open-source version of this pattern well. A trace contains nested retrieval, prompt, and generation steps; the selected span exposes inputs, outputs, scores, metadata, latency, token usage, and cost. It is especially appealing when a team wants self-hosting, prompt management, human annotation, datasets, and LLM-as-judge scoring in one LLM engineering workspace.
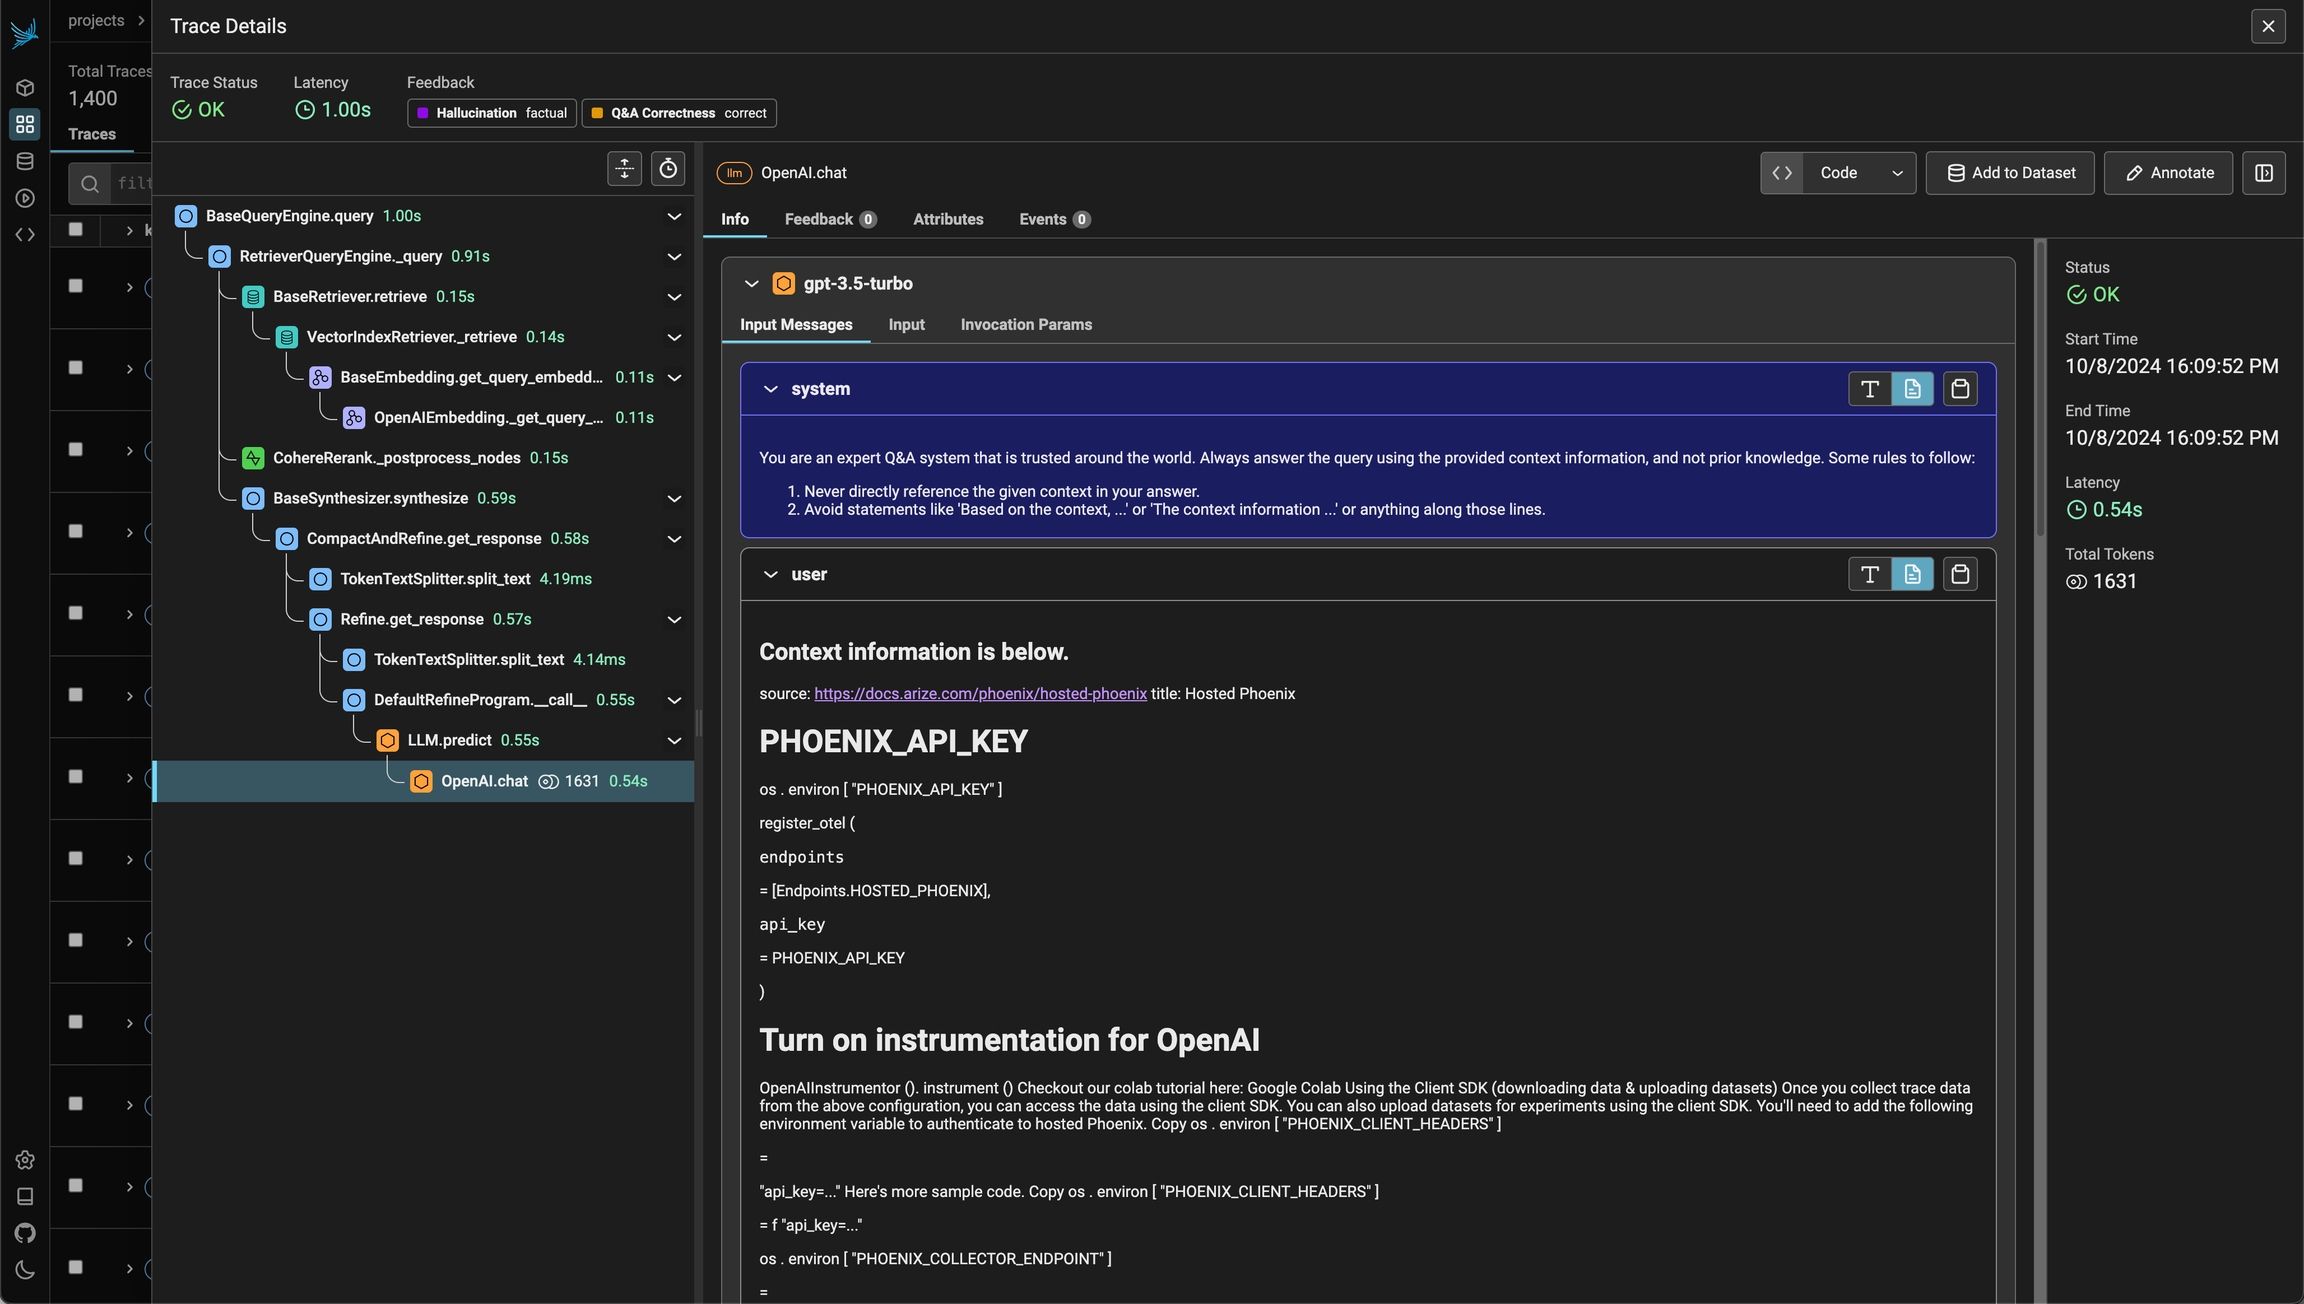
Source screenshot: Phoenix tracing docs.
Phoenix is the cleanest example of the OpenTelemetry/OpenInference direction. It treats traces as portable telemetry, not as a vendor-private artifact. That makes it a strong fit for teams that want local-first debugging, open-source eval workflows, and the option to send the same spans to other OpenTelemetry-compatible systems later.
Market Map
| Tool | Best Fit | Trace/Event Model | Evaluation Loop | Main Tradeoff |
|---|---|---|---|---|
| LangSmith | LangChain and LangGraph teams shipping agents | Traces and runs across model calls, tools, chains, and agents | Datasets, evaluators, experiments, online evals, monitoring | Best when you accept LangChain ecosystem gravity |
| Langfuse | Teams wanting an open-source LLM engineering platform | Traces, spans, generations, sessions, scores, metadata | Datasets, LLM-as-judge, human annotation, prompt experiments | Broad product surface; you must design your own eval taxonomy |
| Arize Phoenix + OpenInference | Open-source tracing and RAG/agent debugging | OpenTelemetry spans with AI-specific OpenInference conventions | Evals for retrieval, response quality, and trace analysis | Less of an all-in-one product suite than hosted platforms |
| Braintrust | Eval-first teams that want production logs connected to release gates | Logs made of traces and nested spans, visible in Logs, Experiments, and Review | Scorers, experiments, datasets, human review, trace-to-eval workflows | Commercial workflow is the center of gravity |
| W&B Weave | Teams already using Weights & Biases or building agent dashboards | Weave traces, OpenTelemetry spans, agent/conversation/span views | LLM judges, custom scorers, feedback collection, experiments | Most compelling if W&B is already part of your stack |
| Helicone | Teams that want fast LLM monitoring, cost analytics, and session tracing | Proxy-first request logs plus sessions for multi-call workflows | Eval scores, datasets, user feedback, cost and usage reporting | Great for observability entry; deeper eval rigor may need extra process |
| Galileo | Enterprise teams that need reliability, guardrails, and production protection | Agentic traces, evaluation signals, monitoring, and guardrail events | Offline and online evals, real-time protection, enterprise workflows | More platform commitment; less lightweight than OSS-first tools |
| MLflow 3 GenAI | Databricks or MLflow-heavy teams | Realtime trace logging for GenAI apps and agents | Built-in/custom scorers, human feedback, version tracking | Best inside the MLflow/Databricks operating model |
| OpenTelemetry + OpenInference | Teams optimizing for portability | Vendor-neutral traces with AI span conventions | Depends on the backend: Phoenix, Arize AX, custom OTel stack, or other observability tools | Standards give portability, not a complete product by themselves |
Product Notes
LangSmith
LangSmith is the natural default when the agent is built in LangChain or LangGraph. It supports both offline evaluation before shipping and online evaluation in production. The most important workflow is trace promotion: take real failing production traces, add them to a dataset, write or tune evaluators, run experiments, and redeploy with regression coverage.
Where it shines:
- Debugging agent trajectories with native LangChain/LangGraph structure.
- Turning traces into datasets and repeatable experiments.
- Comparing prompt, model, tool, and chain changes before release.
- Monitoring production with online evaluators and dashboards.
Where I would be careful:
- If your stack is deliberately framework-agnostic, confirm how much LangSmith-specific instrumentation you are willing to carry.
- Design your own score taxonomy early. "Correctness" alone will not catch bad tool calls, bad citations, or expensive trajectories.
Langfuse
Langfuse is probably the most practical open-source all-rounder. It gives you tracing, sessions, prompt management, datasets, scoring, human annotation, and monitoring without forcing the whole application into one agent framework.
Where it shines:
- Self-hosted or open-source LLM observability.
- Product teams that want traces, prompt versions, scores, and annotation in one place.
- Agent workflows where each span needs metadata, cost, latency, and score context.
- Teams that want to connect online usage to offline evaluation.
Where I would be careful:
- Langfuse gives you the primitives; it will not define your failure taxonomy for you.
- If you have complex multi-service observability standards, map Langfuse traces to your broader telemetry model deliberately.
Arize Phoenix and OpenInference
Phoenix is useful because it makes the instrumentation story feel less proprietary. OpenInference extends OpenTelemetry for AI applications, and Phoenix can consume those spans for trace inspection and evaluation. That matters if you believe AI observability should eventually fit into the same distributed tracing standards as the rest of production software.
Where it shines:
- Local-first debugging of RAG and agent traces.
- Open-source experimentation without committing to a hosted vendor.
- Teams that want OpenTelemetry-compatible traces.
- Retrieval and response evaluation during development.
Where I would be careful:
- Phoenix is excellent as an engineering workbench, but some teams will still want a hosted review workflow, enterprise permissions, or richer product analytics.
- Standards do not remove the need to decide which spans, attributes, and events matter.
Braintrust
Braintrust feels eval-first. The trace viewer appears across logs, experiments, and review, which is the right mental model: production behavior, offline evaluation, and human judgment should not live in separate tools.
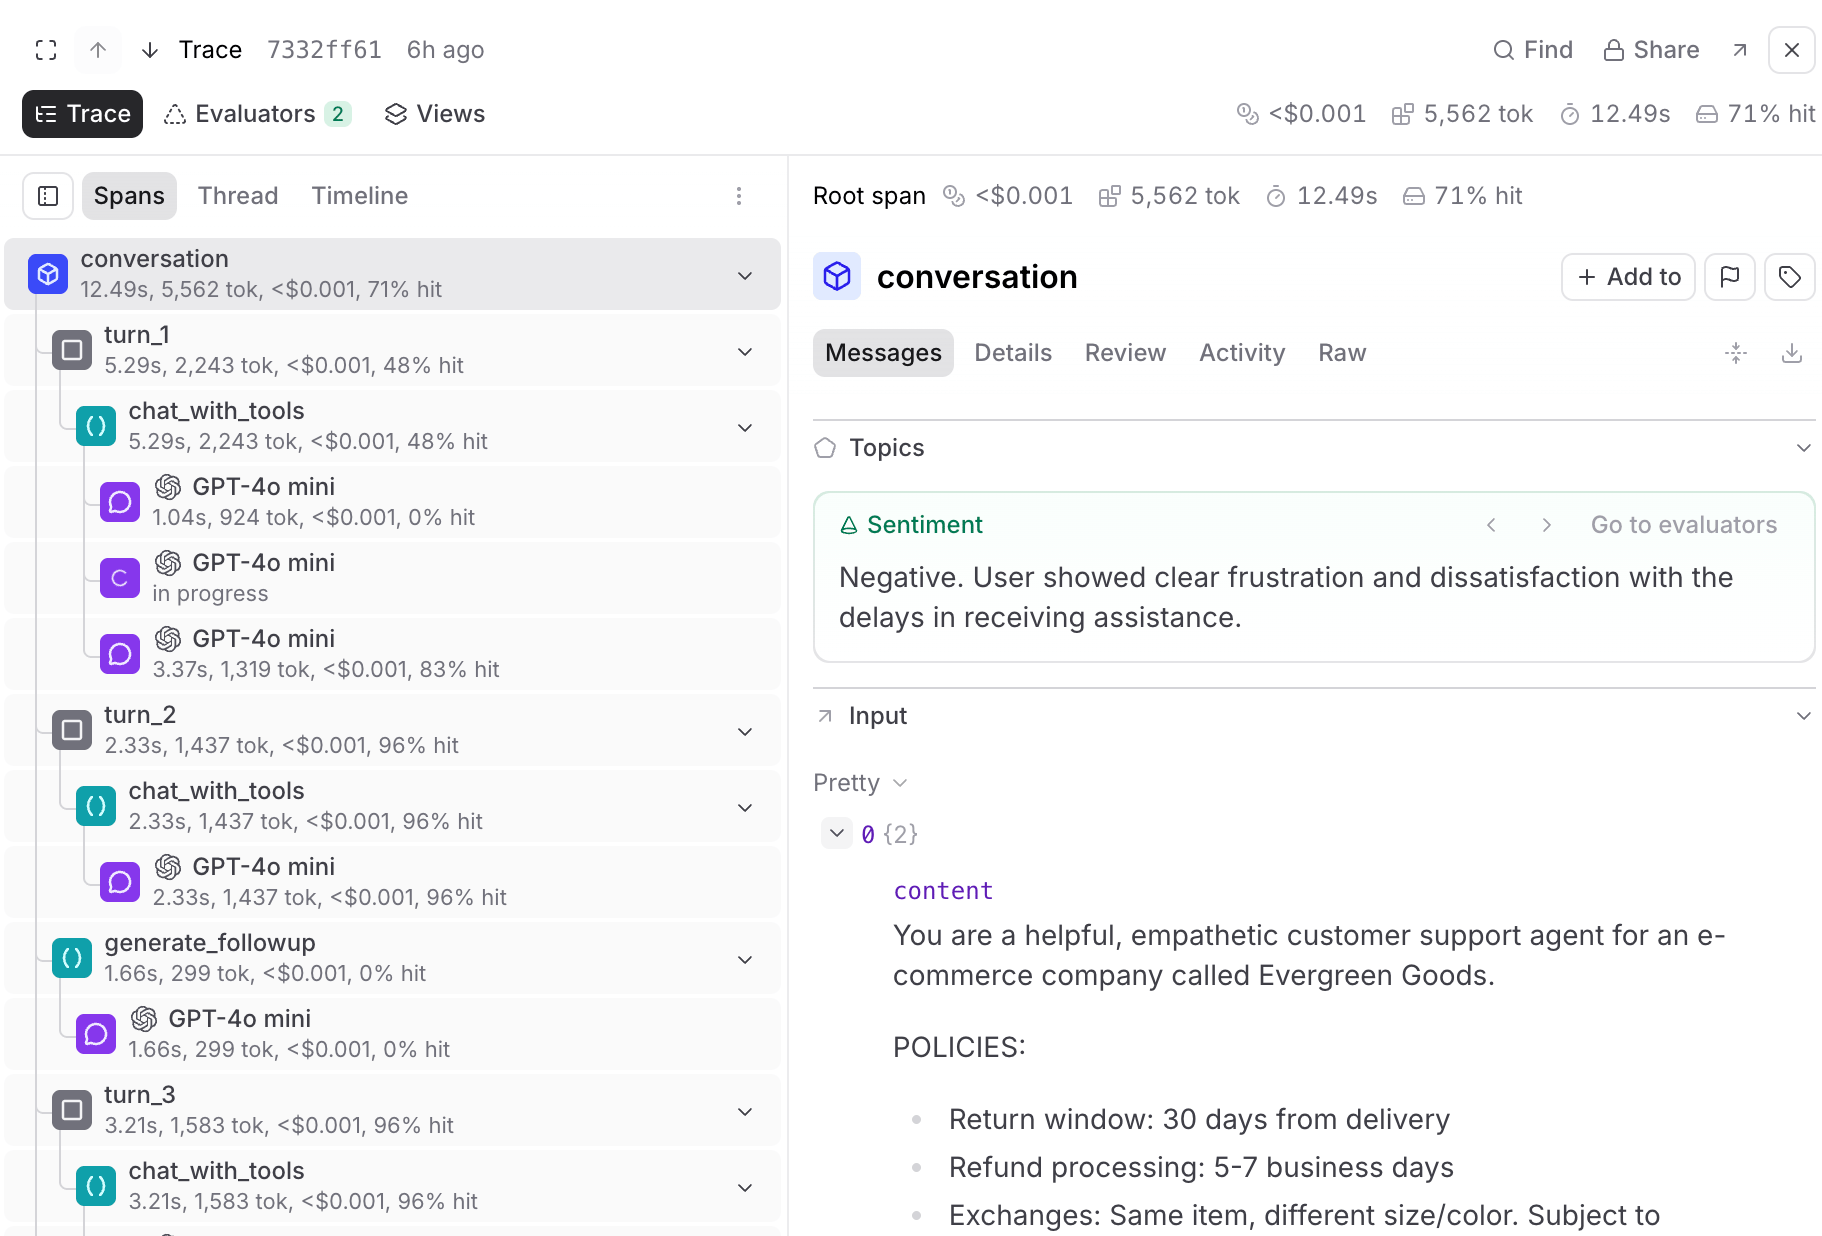
Source screenshot: Braintrust trace viewer docs.
Where it shines:
- Teams that want rigorous experiments and production observability in the same workflow.
- Trace-level review, custom scorers, and dataset creation from real logs.
- Release gating based on evaluation results.
- Collaboration between engineering, product, and domain reviewers.
Where I would be careful:
- Braintrust is strongest when your team is ready to operate evals as a product process, not as occasional scripts.
- If you only need cheap request logging, it may be more platform than you need at the beginning.
W&B Weave
Weave is the agent and LLM observability/evaluation layer from Weights & Biases. The new agent views make the unit of analysis explicit: agents, conversations, spans, signals, and dashboards.
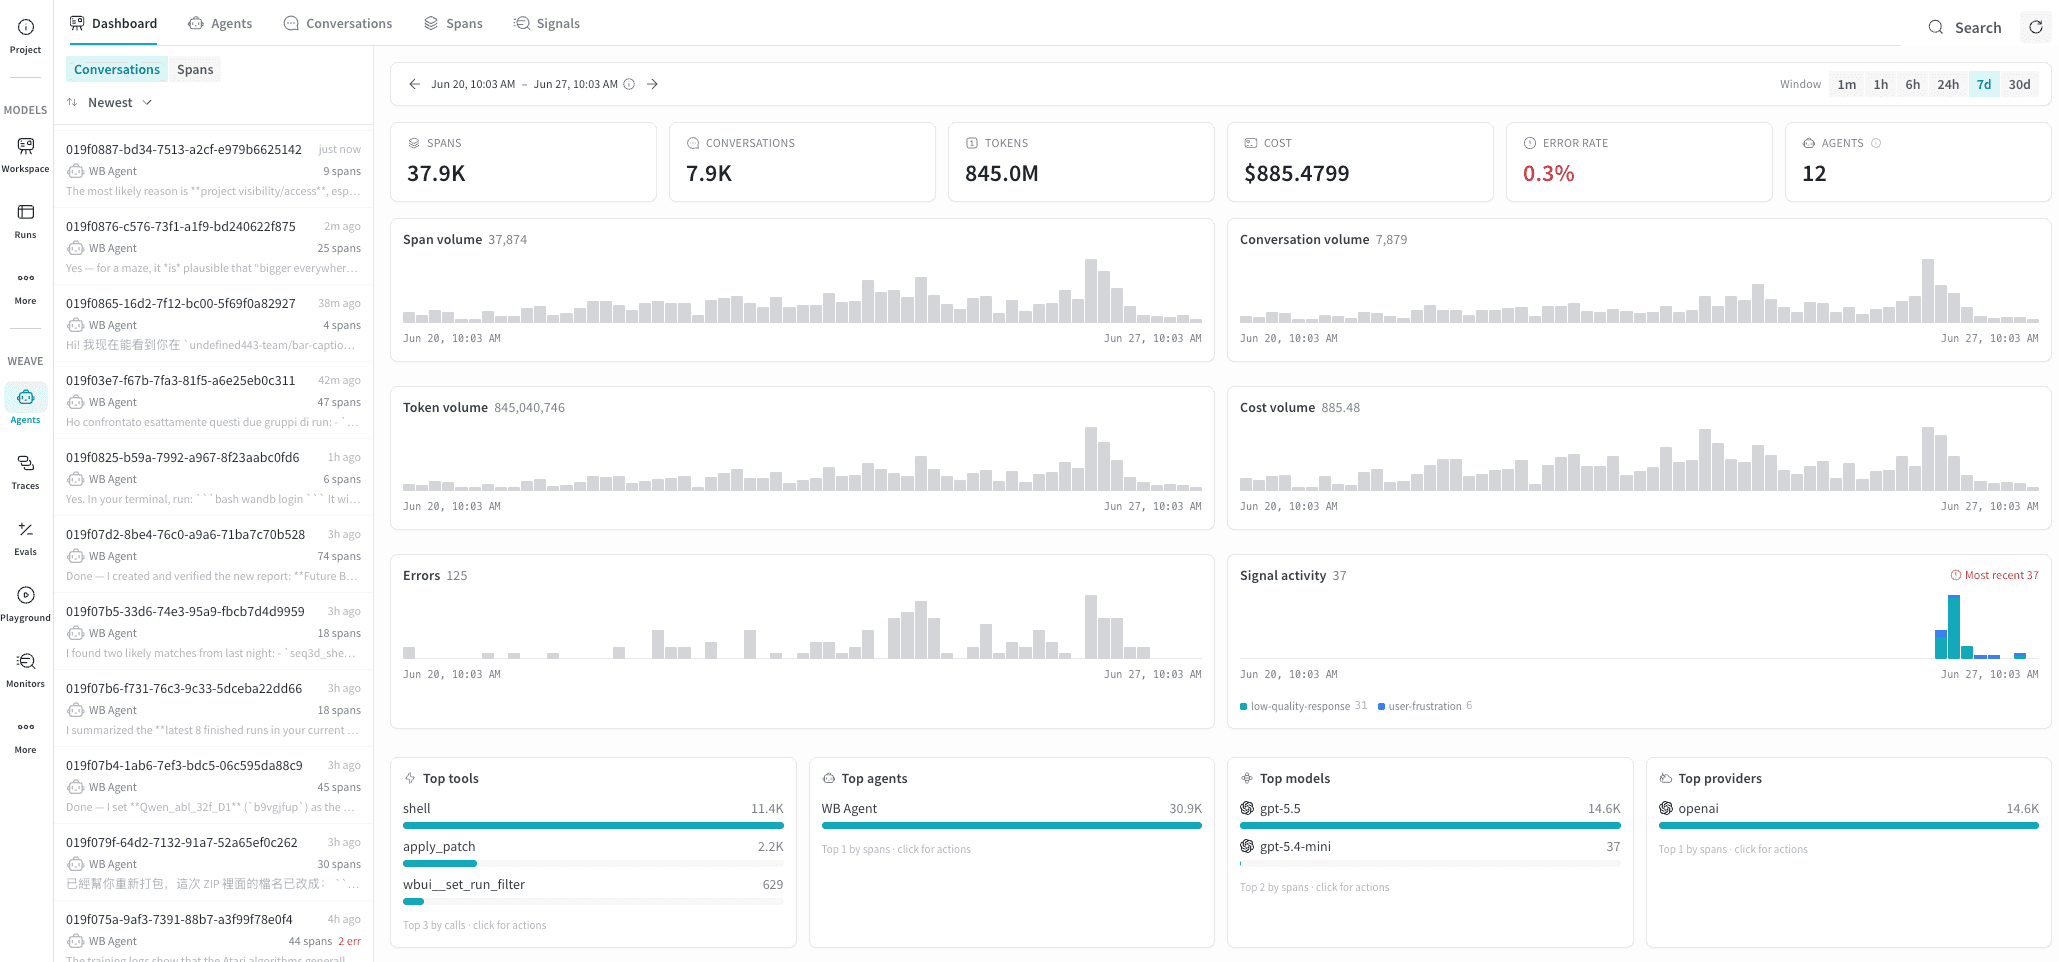
Source screenshot: W&B Weave agent activity docs.
Where it shines:
- Teams already using W&B for experiments and model work.
- Agent dashboards that combine volume, cost, error rate, spans, conversations, and signals.
- Custom scorers and LLM judges connected to trace data.
- Tracking both experimental and production agent behavior.
Where I would be careful:
- If the organization does not already use W&B, compare the adoption cost against lighter LLM-specific tools.
- Decide whether your agent traces belong in the same governance model as the rest of your ML experiments.
Helicone
Helicone starts from a very practical angle: get LLM request observability quickly, then group related calls into sessions. For agentic workflows, sessions are the important concept because a single user task may involve multiple LLM calls, vector database queries, and tool calls.
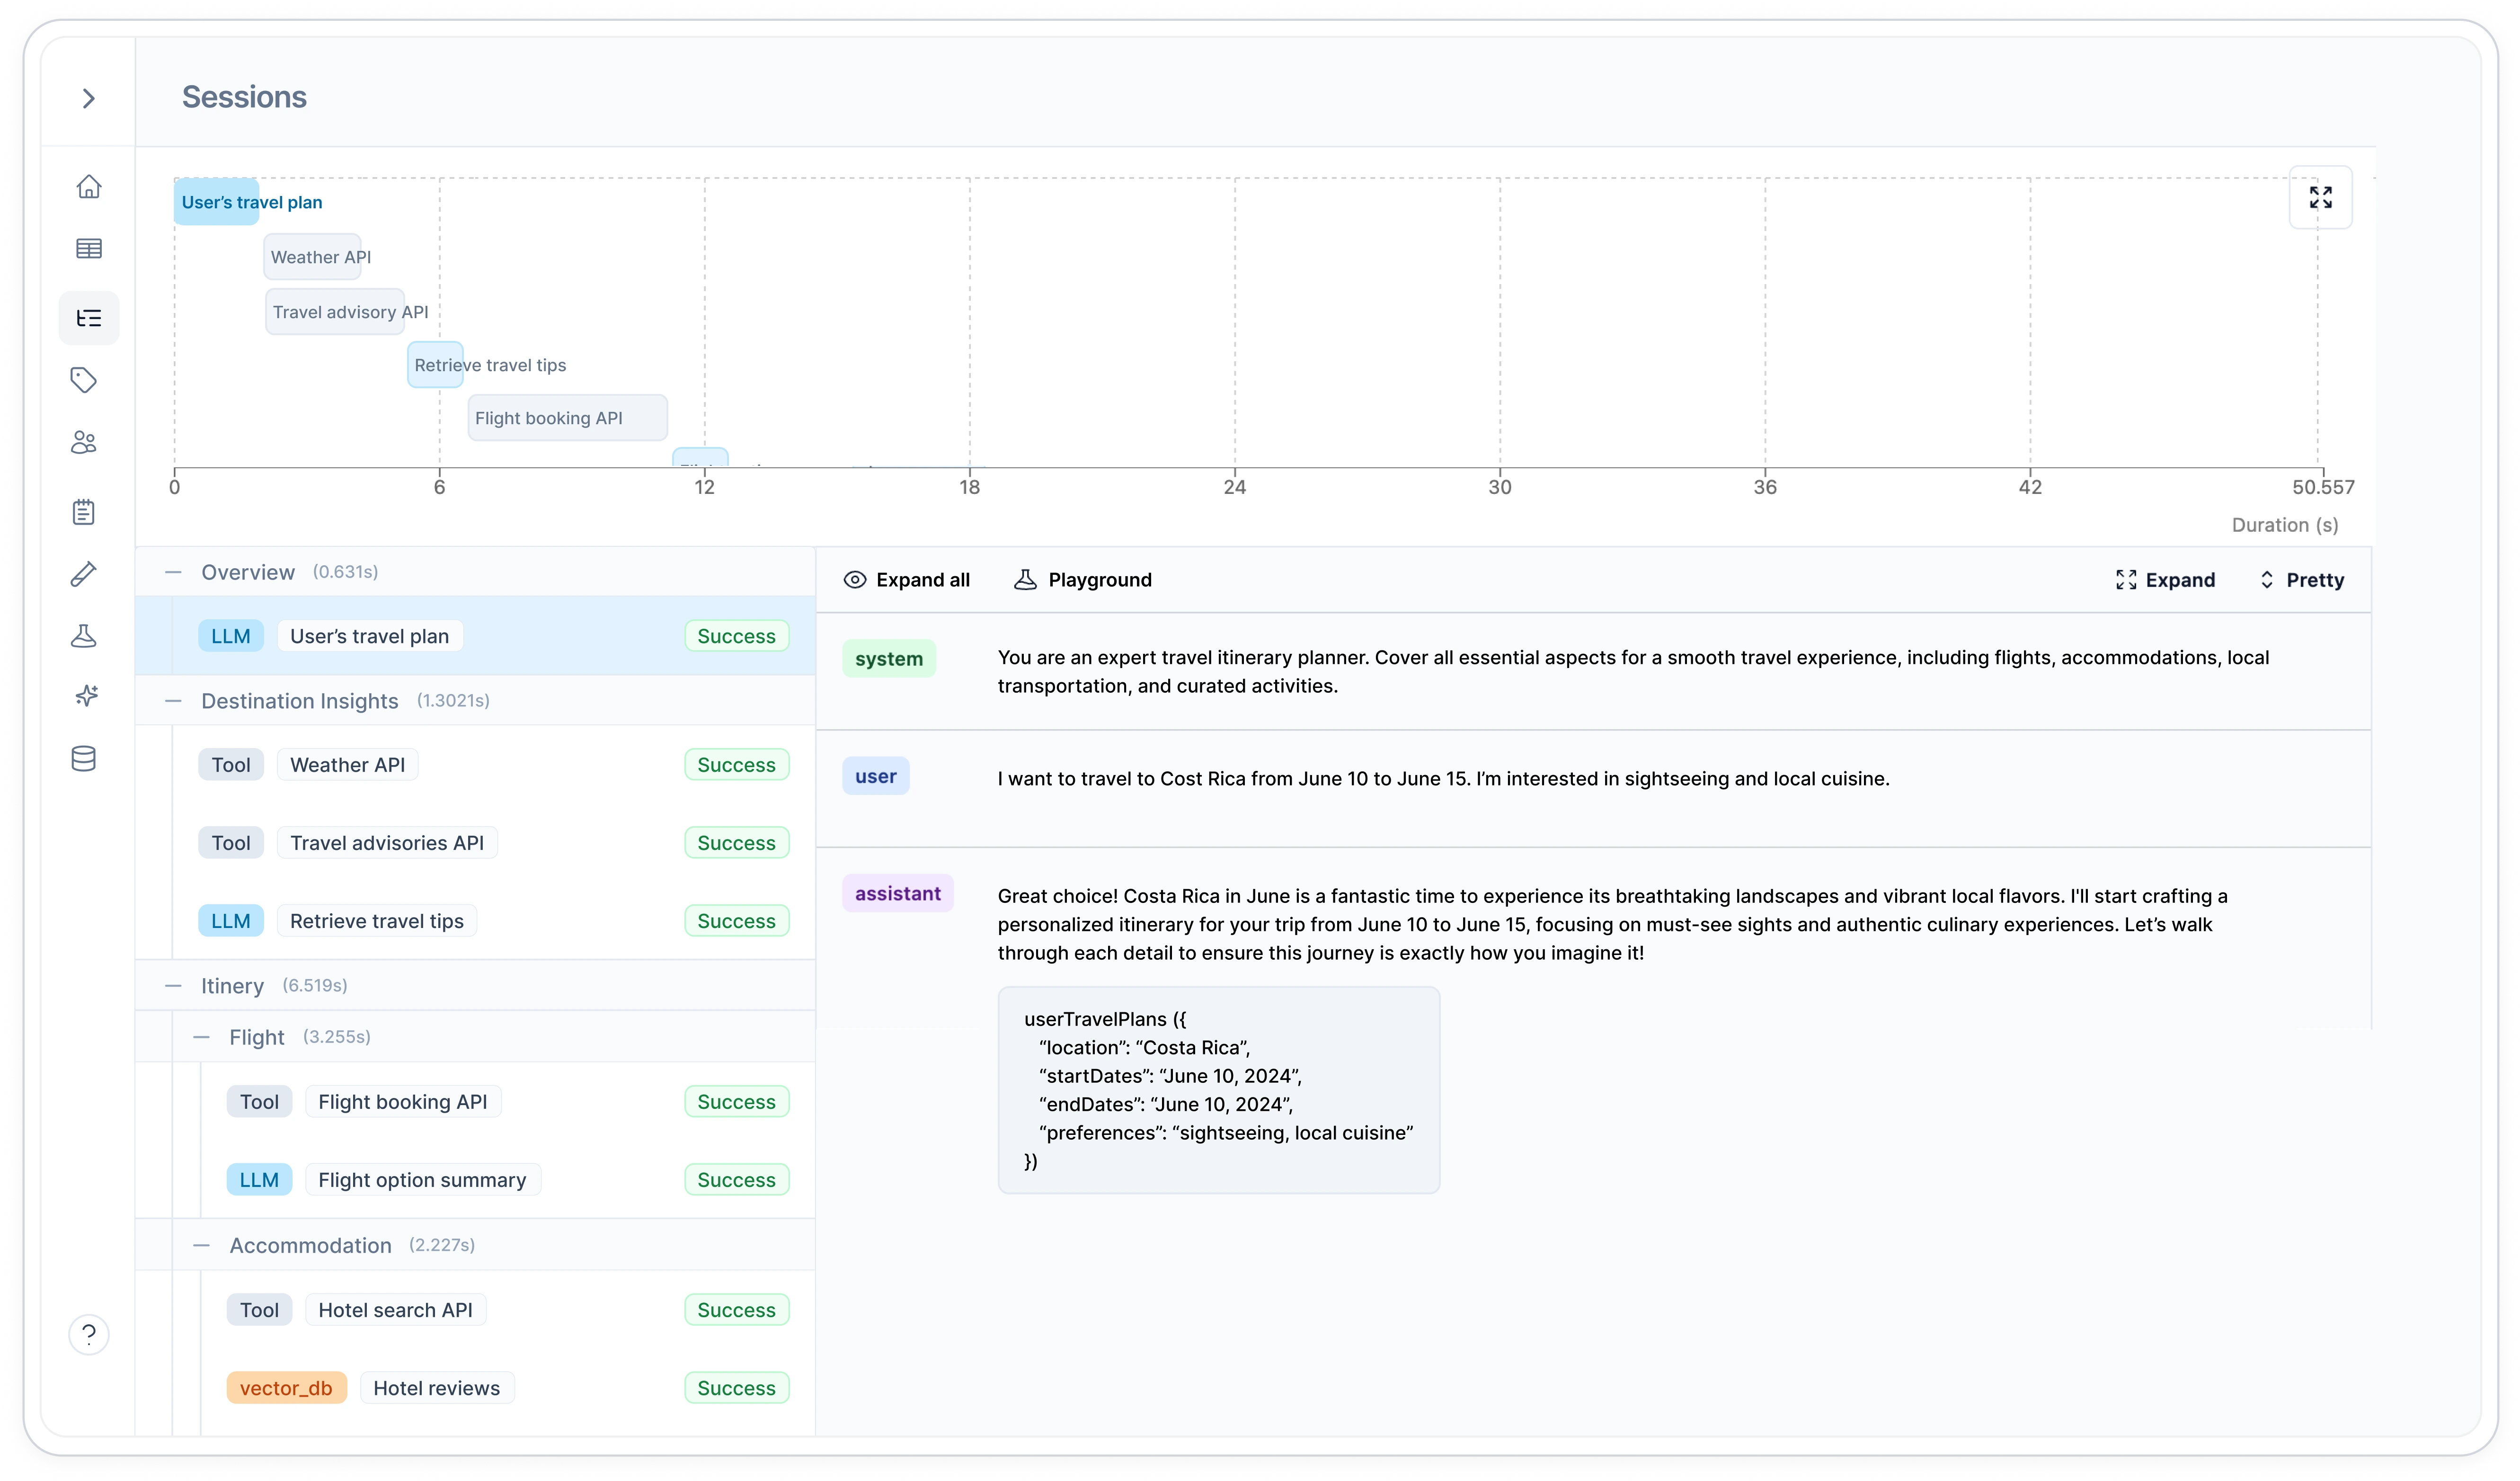
Source screenshot: Helicone Sessions docs.
Where it shines:
- Low-friction request logging and cost tracking.
- Teams that want provider routing, caching, prompt management, rate limits, and analytics near the LLM gateway.
- Session-level tracing for workflows that make many related requests.
- Fast adoption when the first problem is "we cannot see what our LLM app is doing."
Where I would be careful:
- Gateway observability and eval discipline are different layers. Helicone can help collect the data, but you still need rubrics, datasets, and release checks.
- Complex agent trajectories may need more explicit span modeling than request logs alone.
Galileo
Galileo is aiming at the enterprise reliability layer: evaluation, observability, and guardrailing in one platform. The product language is less about a developer trace workbench and more about protecting AI systems at scale.
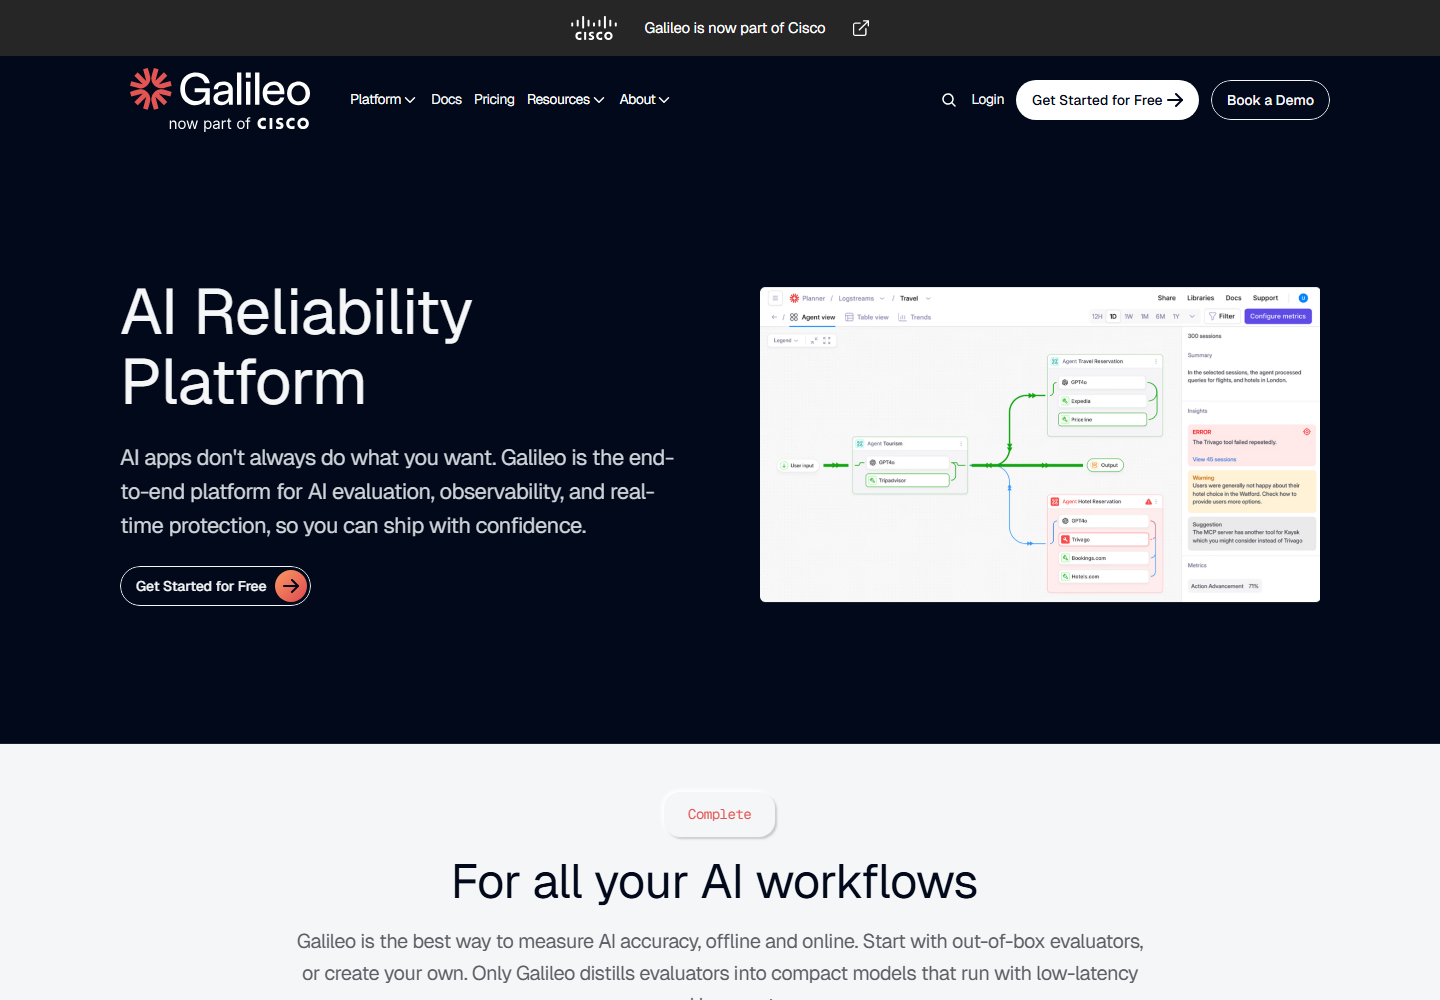
Source screenshot: Galileo products page.
Where it shines:
- Enterprise teams that need quality, safety, monitoring, and runtime protection together.
- Agent systems where guardrails and observability should share the same events.
- Organizations that need stakeholder-facing reliability dashboards.
- Production workflows where online protection matters as much as offline experiments.
Where I would be careful:
- This is a broader platform decision, not just an SDK choice.
- If your team is still learning its failure modes, an OSS trace workbench may be a better first step before buying a reliability suite.
MLflow 3 GenAI
MLflow 3 is important because it brings GenAI tracing, evaluation, and monitoring into a workflow many ML teams already understand. In Databricks environments, it is especially compelling: traces, scorers, human feedback, versions, and deployment metadata can stay near the rest of the ML lifecycle.
Where it shines:
- Databricks or MLflow-native organizations.
- Teams that want AI app and agent traces connected to experiment tracking and model governance.
- Evaluation of production traces with custom scorers.
- Workflows where human feedback and version tracking need to be auditable.
Where I would be careful:
- If you are not already in the MLflow/Databricks ecosystem, compare it against tools that are more focused on LLM product workflows.
- Make sure agent traces are expressive enough for tool calls, planner decisions, guardrails, and retrieval evidence.
The Trace Schema I Would Start With
Before picking a platform, I would define a minimum trace schema. Tools differ, but the concepts transfer.
| Layer | Fields I Would Capture |
|---|---|
| Trace | trace_id, session_id, user_id or tenant_id, environment, release, route, task type, start/end time, status |
| Span | span_id, parent_span_id, span type, name, inputs, outputs, error, latency, token count, cost |
| Model call | provider, model, prompt version, temperature, tool schema version, input/output tokens, cached tokens |
| Retrieval | query, filters, top_k, document ids, chunk ids, scores, selected evidence, citation ids |
| Tool call | tool name, arguments, result, side effects, permission boundary, retry count |
| Event | retry, exception, guardrail hit, policy warning, user correction, escalation, fallback, timeout |
| Score | scorer name, score value, rationale, scorer version, human reviewer id, eval dataset id |
This schema should be boring. Boring is good. It means production incidents, offline evals, and product analytics can speak the same language.
What The Market Is Really Selling
The vendors are not only selling trace viewers. They are selling different operating models.
LangSmith sells the LangChain-native agent improvement loop. Langfuse sells open-source LLM engineering primitives. Phoenix sells open, portable AI tracing. Braintrust sells eval discipline as a team workflow. Weave sells agent observability inside the W&B universe. Helicone sells low-friction LLM traffic visibility. Galileo sells enterprise AI reliability and protection. MLflow sells GenAI evaluation inside the existing ML lifecycle.
Those differences matter more than feature checklists. Most platforms can display a trace tree. Fewer help a team answer the harder questions:
- Which production failures should become regression tests?
- Which score should block a release?
- Which failures are model problems, tool problems, retrieval problems, or product policy problems?
- Who reviews ambiguous cases?
- How do online events flow back into offline evals?
- Can the trace data move if the team changes vendors?
My Practical Recommendation
If I were setting up evaluation for a new agent project, I would not start with a giant benchmark. I would start with a trace-driven loop:
- Instrument every LLM call, tool call, retrieval step, guardrail check, and user feedback event.
- Build a small gold dataset from real traces, not only synthetic prompts.
- Score final answers and trajectories separately.
- Add human review for the first 50 to 100 high-value traces.
- Promote every serious production failure into the eval set.
- Gate releases on task success, citation quality, tool correctness, safety, latency, and cost.
- Keep trace data portable by aligning span names and attributes with OpenTelemetry/OpenInference where practical.
For a LangGraph-heavy stack, I would start with LangSmith. For an open-source, self-hostable default, I would try Langfuse. For standards-oriented local debugging, Phoenix is the first stop. For eval-first release discipline, Braintrust is compelling. For W&B shops, Weave should be in the short list. For fast gateway visibility, Helicone is attractive. For enterprise reliability and guardrails, Galileo deserves a look. For Databricks organizations, MLflow 3 GenAI is the obvious internal option.
The deeper point is that agent evaluation is becoming observability. You cannot score what you did not capture. You cannot improve what you cannot replay. And you cannot trust an agent just because the last message looked good.